Anasayfa
 Canlı Borsa
 Borsa
Borsa Döviz Kurları
 Altın
Altın Hisse Senetleri
 Endeksler
 Kripto Paralar
 Döviz Hesaplama
 Döviz Çevirici
 Kredi Arama

Currently circulating Bitcoin’s approximately 45-46%, about 9 million BTC, are at a loss while prices are at these levels. This situation has historically preceded extreme declines or the market’s transition into a new accumulation phase; investors are now most curious whether a recovery is imminent or if a new downtrend is on its way.
Key points include the amount of BTC currently in loss, which combined with unrealized losses of short-term holders totaling $113.9 billion, is one of the critical indicators determining the market direction. While the parity hovers around $65,200–66,689, it is seen to be approximately 47% below the all-time high of around $126,000. The discussion centers on the current support level of $63,000 and the next resistance point set at $69,000.
What to watch for? The weekly ETF flow totals, movements in whale wallets, and whether the Bitcoin Effect Index (currently at 57.4) will advance into high-impact zones are key indicators guiding market direction.
Percentage Time-Weighted Loss: What Does History Say?
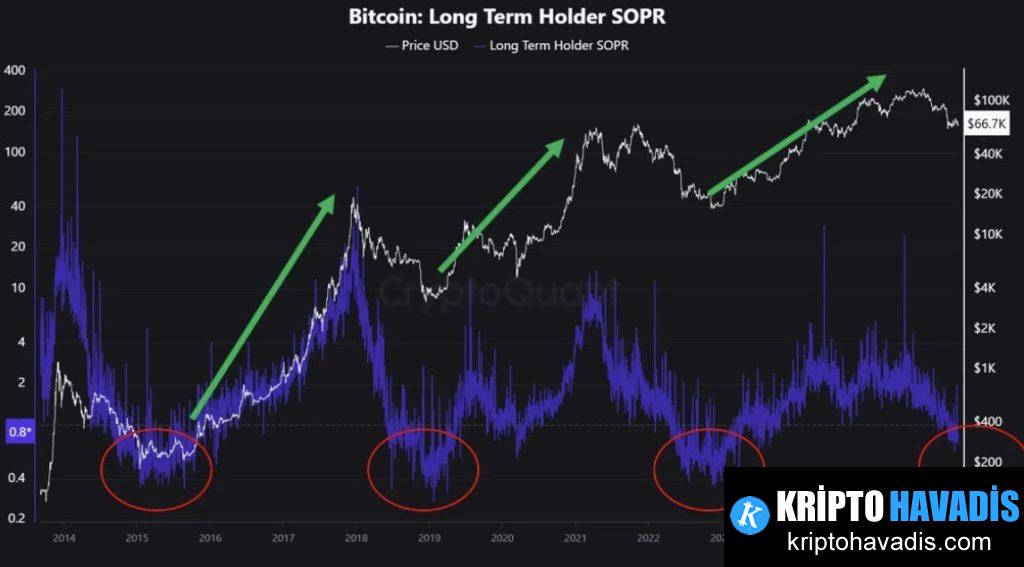
The proportion of supply in loss is calculated by matching each coin’s latest move with a previous price. When the price is around $65,200 today, this group contains approximately 9 million BTC; historical periods with nearly 10 million BTC in loss have also been recorded. Long-term holders (coins that haven’t moved for over six months) saw 30% of their holdings remain in the red, pushing their loss profiles to levels seen since 2023. Indicators that caused similar losses in the past point to the around 50% collapse in 2018 and the slow declines in mid-2022; in 2023, the significant depletion of selling pressure had directed the market toward recovery. However, the current situation differs from the past by not having a major selling pressure. According to CryptoQuant experts, such a high share of losses hints at either capitulation (panic selling) or a late accumulation phase; it is now clear who is driving this pressure: forced liquidations or patient accumulation? It appears that selling pressure remains more dominant.
Another notable finding related to this situation is the difference between the missing selling pressure in 2023 and today; at that time, there was little active selling pressure, and the market was able to recover. This time, it is clearer that flows and the extent of market pressure will be decisive. Even in a scenario where the Bitcoin Impact Index heads toward high zones and moves to around $90,000 within 1-3 months, the current focus is seen on compression and continuous movements.

Main points to watch are whether the $63,000 level is a secure base and what flows are needed to surpass resistance levels over $69,000. ETF flow data has historically been a more reliable predictor of price direction than on-chain indicators. If net inflows exceed $1 billion weekly, it could be a strong signal for a bullish scenario; however, increasing whale outflows might trigger risk again.
The weak market dynamics over the past six months, combined with this underlying supply, are preparing for a clearer resolution. The only reassuring factor is that the major plunge expected during panic selling has not yet occurred; this suggests that oscillations and choppy movements are likely to continue.
As of now, approximately 45-46% of circulating Bitcoin, about 9 million BTC, are in a loss at current prices. This is seen as a sign that previously triggered closures and new accumulation phases; investors are curious about which scenario will unfold today.
Main indicators point to the high level of supply at a loss: unrealized losses by short-term holders total a massive $113.9 billion. While prices are stuck in the range of $65,200–66,689, we are about 47% below the all-time high. The critical support of $63,000 and resistance at $69,000 are the key points that will steer short-term movements.
The guidance from ETF flow functions and whale movements clarifies the market’s dynamics. The level of 57.4 in the Bitcoin Impact Index points to a zone historically associated with major moves. The structural levels between $69,000 and $90,000 over 1-3 months form critical margins and resistances.
As seen in the past, liquidity flows are paramount in determining market direction. Sudden increases in ETF demand can reignite demand, while accelerated whale sales may intensify pressure. Upcoming events will largely depend on market flows, with the $63,000–$69,000 band remaining a key compression zone. It remains uncertain whether a panic-selling wave will develop in this process.